
Greetings, gentle reader, and welcome to the long awaited conclusion to some random thoughts I have about project management and Scrum. For those just tuning in, I’ve already discussed the basics of Scrum in a previous post so you might want to take a peek at that first before diving in here. For those of you who are already Scrum experts, well, um, you’ll likely find all of this way too theory-lite to actually derive any benefit from. BUT for those of you who fall into the sweet spot of having both read Part 1 and still retaining interest in a Part 2, I think this post is really gonna deliver.
Last time, we talked all about using sticky notes, and the importance of breaking your large goals down into component, actionable tasks. Today, I’d like to talk a little bit about the companion tool to the sticky notes: The burndown chart.
What is a Burndown Chart?
I’m glad you asked! The burndown chart is meant to represent how many hours of work you have left in the week. As you may recall from last time, one of the most important tenets of this Scrum system is not to keep track of how many hours you’ve worked thus far, but rather to consistently re-evaluate how many more hours you have left before you can complete any given task. The burndown chart is a nice way to visualize how many more hours you have left to accomplish on the ‘Sprint’ level. The notion of the Sprint was, you guessed it, also covered in part 1, but the quick summary is that you give yourself some number of goals to accomplish in a short-ish period of time (usually between one to two weeks), and then that helps you to figure out what specifics need to get done to achieve those goals, which in turn helps you to focus on actually achieving them. That aforementioned short-ish period of time is called a Sprint.
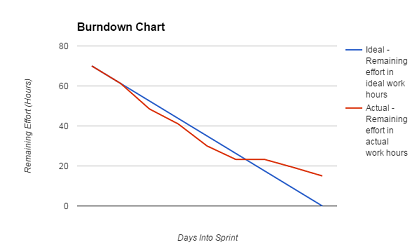
To illustrate the concept of the burndown chart, let’s use a hypothetical example. Let’s say that our Sprints are one week long, and we’ll pretend that after thinking long and hard about everything we need to get done this week, we’ve estimated that it’ll take us roughly 70 hours to accomplish it all. That means that, at the beginning of the Sprint, our burndown chart might look a little something like this:
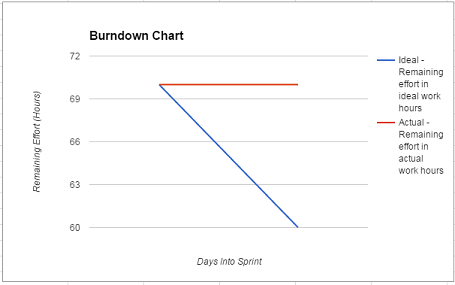
We can see that we have two lines: ol’ red and faithful blue. Although the colors are arbitrary, their meanings are not. One line (here, the red one) represents how much work we still have left to do this week. The other represents how much work we theoretically should have left to do by the end of the day assuming we live in a perfect world and got an even amount of work done every day of the Sprint. The power of some napkin math teaches us that if we have 70 hours of work we want to get done in the week, and 7 days in which to do them, then ideally we’ll accomplish a whomping 10 hours of work every day. And indeed, the blue line goes from 70 to 60.
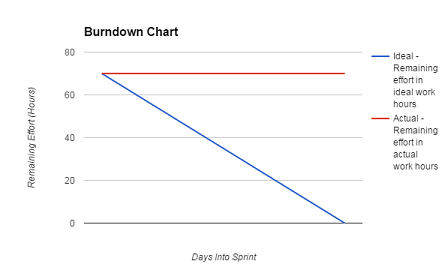
It’s also worth noting that the above is just looking at a ‘single day’ of the burndown chart. I personally find it looks a lot cleaner to only have the graph go up to the ‘current day’ of the sprint, but to help provide a holistic sense of what we’re working towards, here’s what the chart in its entirety would look like right now:
This is what the chart looks like at the beginning of the week. But as you begin to do more and more tasks, the red line will slowly begin to catch up with the blue line. Let’s pretend that we were very productive on this first day of the sprint, and managed to accomplish twelve hours worth of work! (Note: this does not necessarily mean that we worked for twelve hours! We may have worked for fewer than twelve but worked so efficiently that we got tasks done faster than we estimated, or it might mean that we worked for more than twelve hours but due to unanticipated difficulties only knocked off twelve hours worth of work.) That would mean that we’re ahead of the blue line by a couple of hours, and our chart at the end of day one would look a little something like this:
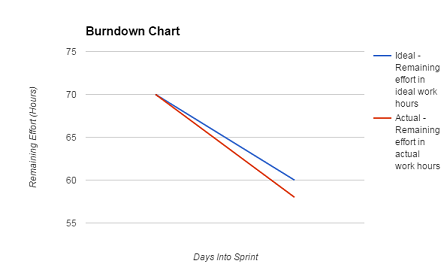
This vision of loveliness means that we’re ahead of schedule. Now, again, there’s tons of theory out there that can teach you the tips and tricks you’ll need to really analyze and interpret these charts, full of opinions about what these burndown lines should look like when a team (or, in my case, an individual) is really pushing themselves to their limits. I highly encourage you to read all about them! For now, we’re adopting the comfortingly naive view that getting all of your work done is good, and thus doing enough work to meet or beat the blue line each day is the goal we should be striving for.
Where Do Burndown Charts Come From?
Now, you might be wondering, from whence do these burndown charts get made? Although there definitely exist sample burndown charts that you can download to get started, I would encourage you to create a chart for yourself from scratch (perhaps using a tutorial as a launching off point). Doing so will enable you to custom tailor it to your needs.
But that didn’t actually answer the question as to what we are using to make the charts themselves. Although I’m positive that there are some fancy applications that specifically cater to the needs of the Scrum burndown chart, my recommendation would be to simply find yourself some spreadsheet software, such as Microsoft Excel or the excellent (and free!) spreadsheet functionality that comes bundled with Google Drive. If you opt to use software such as this, then all you really need to do is to enter your tasks on your spreadsheet and keep their remaining time estimates updated throughout the week. Doing that will enable you to quickly and easily select the data you want to create a graph of, and presto chango, instant burndown graph!
Now, ah, of course I say that it’s really easy, and it is, provided you are familiar with using spreadsheet software. If you’re not, then I appreciate that the task can seem a little daunting. However, the tutorials I’ve linked to above should help get you started. And who knows, if there’s enough demand, maybe I’ll really get into the specifics of building a nice spreadsheet in a Part 3 of this series. But as of right now, I’m not planning on going into those details.
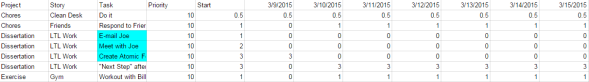
Instead, I’ll talk about the rows and columns of my specific burndown chart. A too-tiny-to-likely-be-helpful image of a section of one my burndown charts can be seen here:
Let’s talk about the columns first.
The Columns
- Project: This is the ‘overarching category’ that any one of your tasks will subscribe to. It should be a ‘big goal’ that you likely won’t be able to completely accomplish until many Sprints have gone by. You can (maybe) see that I have such lofty projects as “Dissertation” and “Exercise” the latter of which will of course never be truly done. The former feels that way sometimes too. But I digress…
- Story: I’m not gonna lie, this is a term borrowed from some of those theory cites I linked to above. I bet people are *really* use *actual* scrum (as opposed to the boiled down simple version that I lifted for my own purposes) could tell you all about it. What I *can* tell you is that it is mean to capture some specific bit of user experience. Like, we want the user to be able to launch the game from the start screen or we want my advisers to be able to understand the goals of my dissertation by reading my thesis’ introduction. Things that are user-centric. I, however, pretty much just this as an additional layer of sorting, to further divide the previous ‘project’ step into further categories. That is, what kind of exercise is it? It’s Gym! (as opposed to, say, running). What part of my dissertation is it? It’s another project, as opposed to actually writing! Does it make sense for me to still be calling it story? Probably not, but if everything I did made sense, then I wouldn’t know who I was anymore.
- Task: And THIS is the actual, broken down, teeny tiny task that you’ve already written on a stickynote. Things like “send that e-mail” or “do 10 squats. We talked all about the philosophy behind these guys last time, so I don’t think we need to discuss them again today.
- Priority: This is a number (as arbitrary as you’d like it to be) that represents how “important” any given task is. I like to give my tasks priority levels between 1 and 10, with 10 being high and 1 being low. High priority tasks tend to be things that have impending due dates, things that are “blocking” other things from getting done, or tasks that I find scary and that I know I’ll likely put off if given half a chance. I usually sort my charts based on the priority levels of tasks, so that the most important responsibilities float to the top!
- Start: This is my initial estimate (in hours) for how long I think the task should take. 0.5? It means I think that after spending an honest half hour working on it, it’ll be done! 3? It means three hours of labor will (hopefully) see the task through to its completion. 10? Ah, well, it probably means that I really don’t have a good sense as to how long it will take, but I’m predicting a lot. One of the cool things about using this system consistently is that I find it actually helped me get a lot better at estimating how long tasks would take, which has a direct correlation with how efficiently I could fill my week.
- The Dates: Each cell here represents how much time remains on a task at the END of the day. A zero here means that the task has been completed! If the time is the same as the previous day, it means it hasn’t been worked on. If the number is different but non-zero, it means it’s been worked on but not yet finished. And remember, just because you work on something doesn’t mean the number will go down the amount of hours that you’ve worked on it! You need to honestly ask yourself at the end of each day: how much longer will it actually take for me to finish this, and then that is the number you write down.
The Rows?
So, er, we just talked all about the columns. So shouldn’t the rows simply be filling them in based on the previously described headings? And although the answer to that is mostly yes, there is one special thing I’d like to point out.
When you use this system, when you change the amount of time remaining on a task (maybe you finished it, maybe you chipped away at it, maybe you realize that it’s going to take longer than your initial estimate, whatever), you need to copy that new time to every remaining day for that task. Although it’s a little bit of a pain, it makes sense, right? If you finish a task on Tuesday, it doesn’t automatically get more hours on Wednesday! Heck no! It’s just as done on Wednesday, Thursday, and beyond as it is on the day that you finished it. And so that’s why the copying thing happens. People better versed in spreadsheet magic than I could surely make it happen automatically somehow. Doing so is an exercise left to the reader, because I’m too lazy and I kinda even like the copying, gosh darn it.
Oh, and you can see that tasks turn ‘blue’ when they are done! I did that! I feel like it’s a nice little visual cue that you’ve gotten something done! As the sprint progresses, soon all of your tasks will turn blue. And it’ll look real nice.
The Payoff
If we zoom down to the ‘bottom’ of the spreadsheet, we can see the final, few, lowest priority tasks (This week it involved cooking and talking with my friend Bryan, who is an amazing individual and I really should prioritize higher but I feel guilty whenever I prioritize non-work over work. If you’re reading this Bryan, I’m sorry!) and the numbers that we’ll actually be using to create our beautiful burndown chart.
Let’s go over them now, shall we?
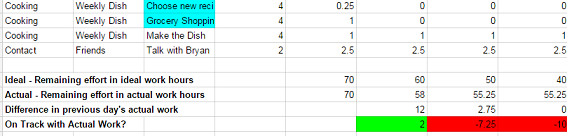
Ideal – Remaining effort in ideal work hours simply takes the sum of all of the ‘start’ times, looks at how many days we are dealing with (here, 7), and then assumes that you should be getting totalTime/numDays amount of work done each day! So if we had 70 hours worth of work and 7 days in which to do it, then at the end of day 1 we should have 60 hours left, 50 hours by the end of day 2, and so on. This is what is used to create the blue line seen above!
Actual – Remaining effort in actual work hours takes the sum of each of the columns, as that is how much ‘actual’ work we estimate we have left. Simple as that! This is the red line on our burndown chart.
Difference in previous day’s actual work This is just a simple calculation that looks at “remaining work hours” from “today’s” date and compares it against the “remaining work hours” from yesterday’s date. It ultimately turns into a nice way of seeing how much you’ve gotten done today.
On Track with Actual Work This poorly named line is just getting at if we have successfully done “all we need to” today, or if we still need to chip in some more hours before we meet all of our goals. It’s essentially just the ‘actual’ remaining hours minutes the ‘ideal’ remaining hours. I like to color it green if the actual remaining hours are less than the ideal, and red if otherwise (just as a quick way for me to see if I had a ‘good day’ that day and got a lot of things done).
But really, those last two lines are just other views on the same data. All you need for your burndown chart are those first two lines! Tell your spreadsheet program to make a graph using em, and voila, you’re done!
So Now I’m Productive Forever
Using this system has definitely helped me tremendously. I find that I get more tasks done in general, and that the work I do tends to be of a higher quality because I’m really focusing on it. Throughout the weeks, I’ve experimented starting Sprints on different days of the week (I find Wednesday and Thursday tend to be best for me, don’t ask me why!), I’ve experimented with lengths of sprints (7-8 days are my current favorite!), I’ve dabbled with the total amount of time to put into a week (certainly anything above 11 hours a day is asking for things to be left undone by the end of the week), and I’ve toyed with putting different types of tasks on the chart (essentially, I’ve settled on anything that I feel makes me grow as a human being that I might not naturally budget the time for (or indeed, even want to do) on my own).
That said, it’s not foolproof. Some Sprints are definitely better than others, and even on my best weeks I’ve never managed to fully complete everything I’ve set out to do. That might speak to me needing to tweak my goals to be more realistic, but I also think that not completing everything might not be the end of the world. Sure, knowing your abilities and charting your week out based on them seems like something effective and successful people are likely to be able to do, but I also think there’s something to be said for aiming higher than you can actually achieve. As long as my goals aren’t too outrageous, I find feeling ever-so-slightly out of my league to be strangely motivating. Even if it means that almost all of my burndown charts look like some variation of this:
That is to say, essentially on task until the weekend, and then never quite managing to catch back up. But as we talked about last time, the goal of this whole setup is to help you, and to be proud of what you are managing to achieve, rather than to chastise yourself on what you don’t. If you find yourself feeling guilty for not achieving the arbitrary goals you set for yourself, and you felt like you were putting in your honest best effort to achieve them, then consider setting slightly lower goals! All of us are just trying to do our best in this crazy world of ours, and we all need to find our own paths to living the lives that we want to lead.
I just hope that, in some slight way, the path I’ve been travelling on these past few months helps you as it has helped me.
Goodnight, gentle reader.
Tags: Project Management, Scrum